

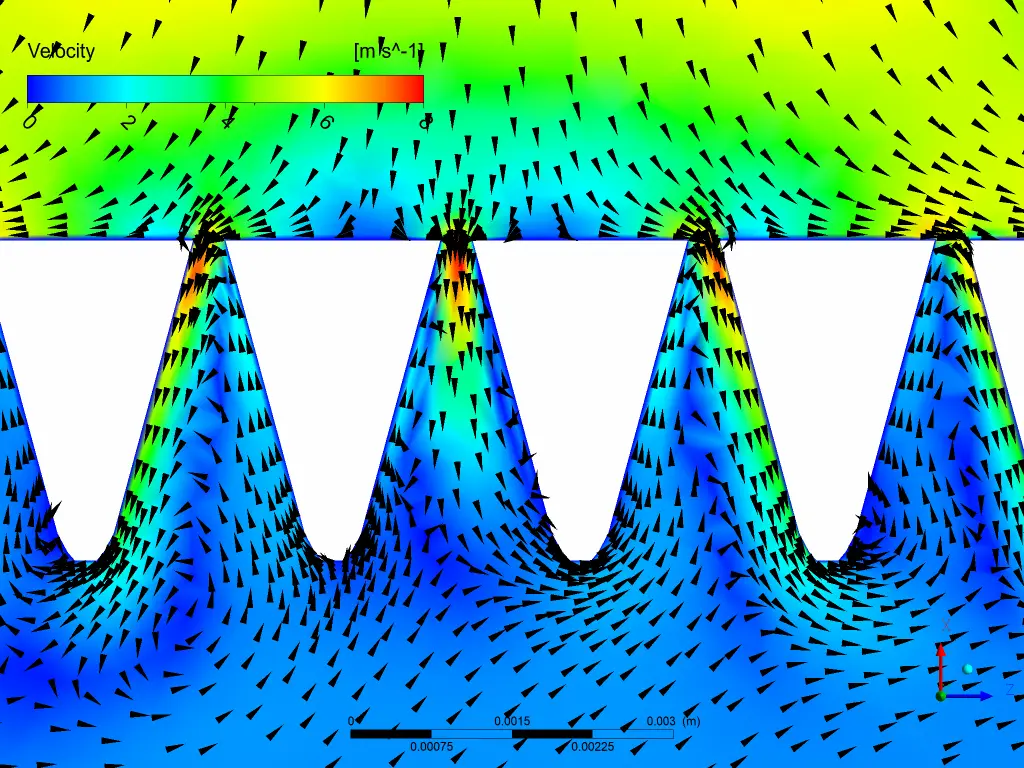
Sand Screen Erosion
Wear modelling of downhole sand screens in gas production. Service-life prediction and identification of critical erosion zones.
Results accepted by Petronas.

Independent CFD engineer. I model fluid dynamics, heat transfer and erosion — from root-cause analysis of failures in equipment already in service, to validation of design decisions before commissioning.
I work with clients in Russia and Malaysia, and hold ongoing discussions with companies across the CIS and the UAE.
Every project ends with a technical report that can be used for a feasibility study, third-party review, or submission to regulatory authorities (at the client’s request).
Jet break-up modelling, contaminant concentration and gas distribution within the flow.
Selection of the appropriate model (VOF, Eulerian, Mixture) for a physically realistic description of how different media interact and how phase change occurs.
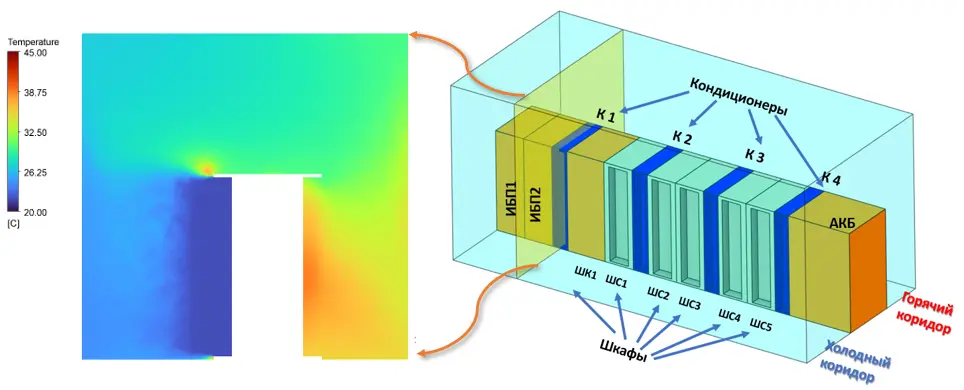
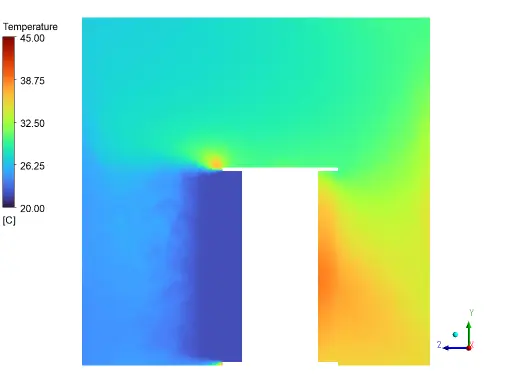
Temperature and air velocity fields in large production halls, hangars, warehouses and data centres.
HVAC optimisation to hold target humidity levels and eliminate hot spots in technical rooms with high heat loads.
Coupled simulation of fluid flow and the stress–strain state of the structure.
Assessment of how pressure and flow pulsations affect the integrity of equipment and piping.
Service-life prediction for equipment.
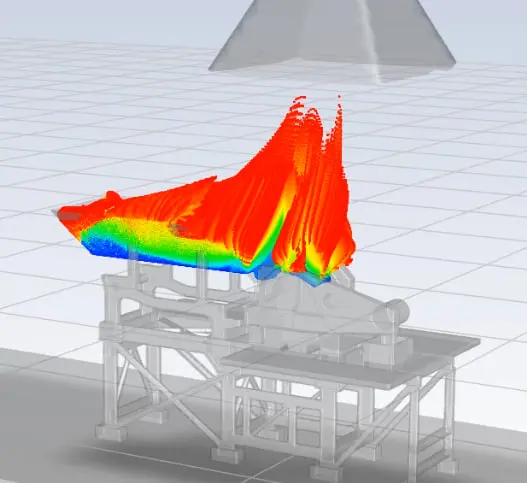
Particle trajectory modelling and identification of critical wear zones in filters, screens, pumps and valves.
Convective and radiative heat transfer in furnaces, reactors and cooling systems.
Optimisation of temperature gradients to prevent overheating and unplanned shutdowns.
Modelling of sound propagation and flow-induced (aerodynamic) noise.
Sound pressure level assessment and recommendations for reducing noise from engineering systems.
A tender proposal, a feasibility study for the owner, a document for regulatory authorities, or sign-off with the design institute.
Simulation turns “this is the solution we propose” into “this is the solution we propose, and here are the numbers that prove it”.
The head–flow curve doesn’t match the datasheet. The unit vibrates for no obvious reason.
Screens fail ahead of schedule. Simulation answers the question: what is actually happening inside.
Reworking at the installation stage costs tens of times more than the simulation itself.
Simulation exposes stagnation zones, overheating and risks before the equipment is purchased.
A parametric study compares configurations faster than physical testing.
Geometry and operating regimes are evaluated before the decision is made.
Wear modelling of downhole sand screens in gas production. Service-life prediction and identification of critical erosion zones.
Results accepted by Petronas.
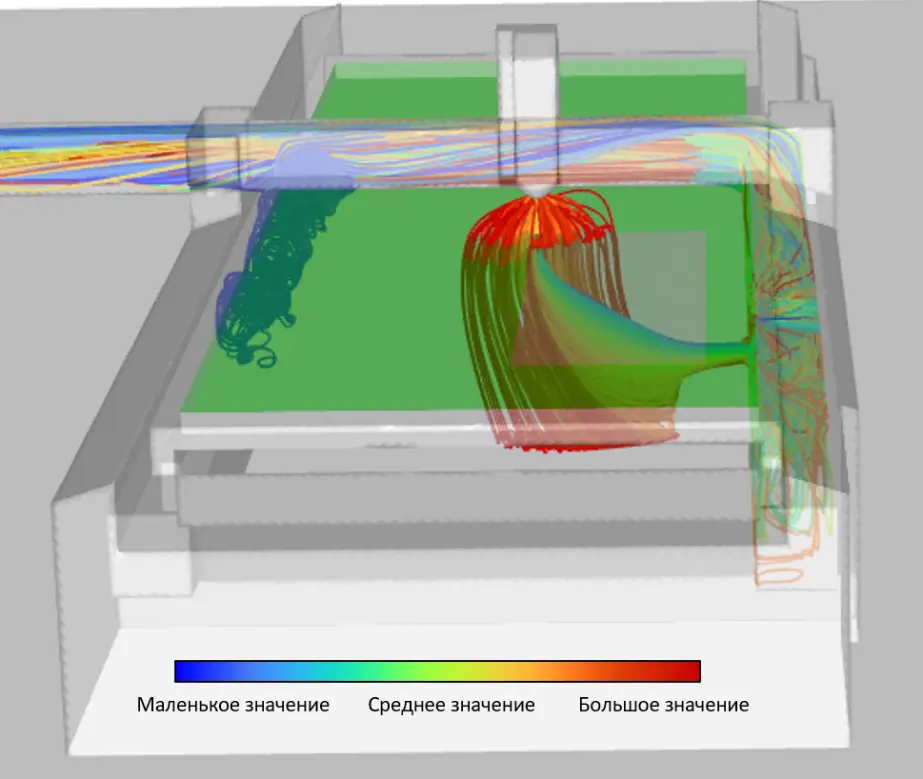
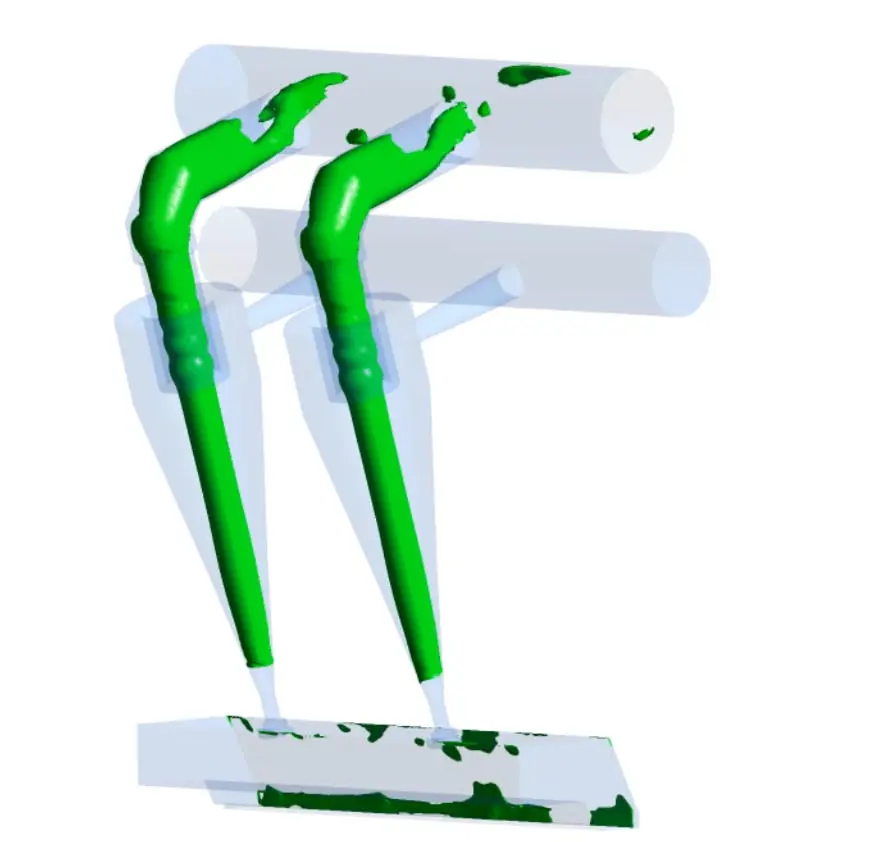
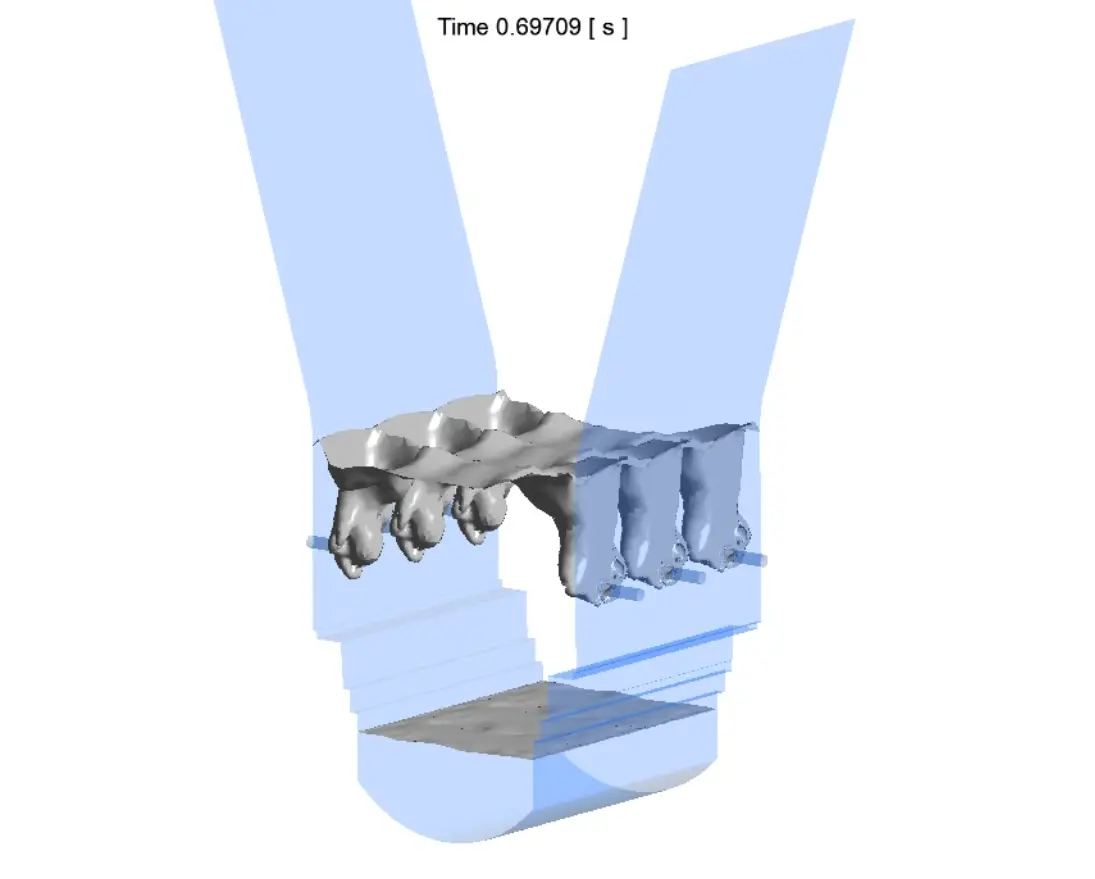
Design and verification of a machine’s dust extraction system ahead of serial production.
A six-fold reduction in pneumatic load on the extraction unit and a 23% increase in dust capture efficiency.
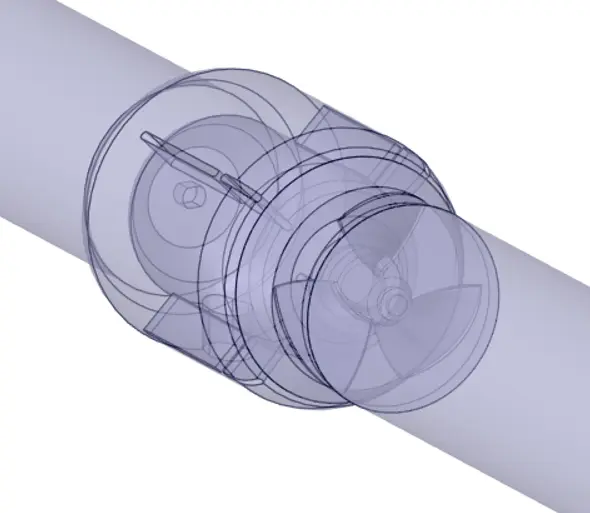
An independent CFD audit of an axial pump that delivered 2.5 times less flow on the test rig than its datasheet value.
The work confirmed the product geometry was correct and traced the discrepancy to a systematic measurement error caused by the test rig layout.
Send a brief description or your technical specification — I will review the details and reply with a proposed solution within 24 hours (UTC+7).
All work under NDA
Identify why downhole sand screens were failing prematurely in a gas well. The equipment was breaking down in under six months due to abrasive sand.
The client needed engineering justification for changing the well completion layout, and needed to defend that design decision before the technical board.
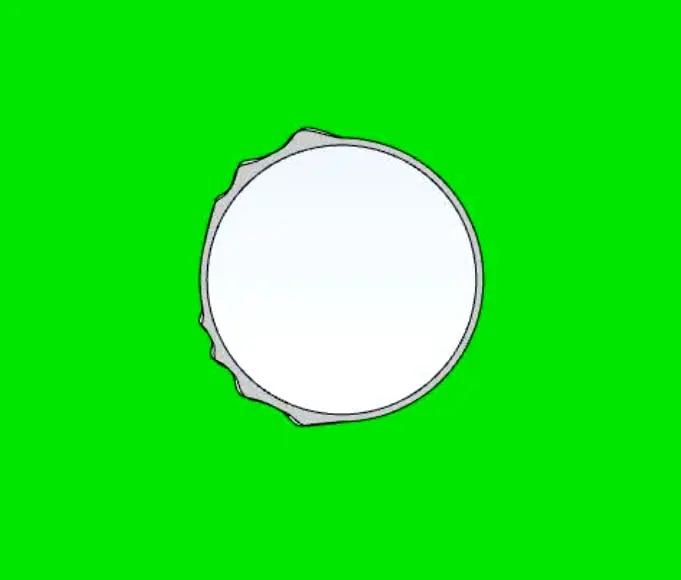
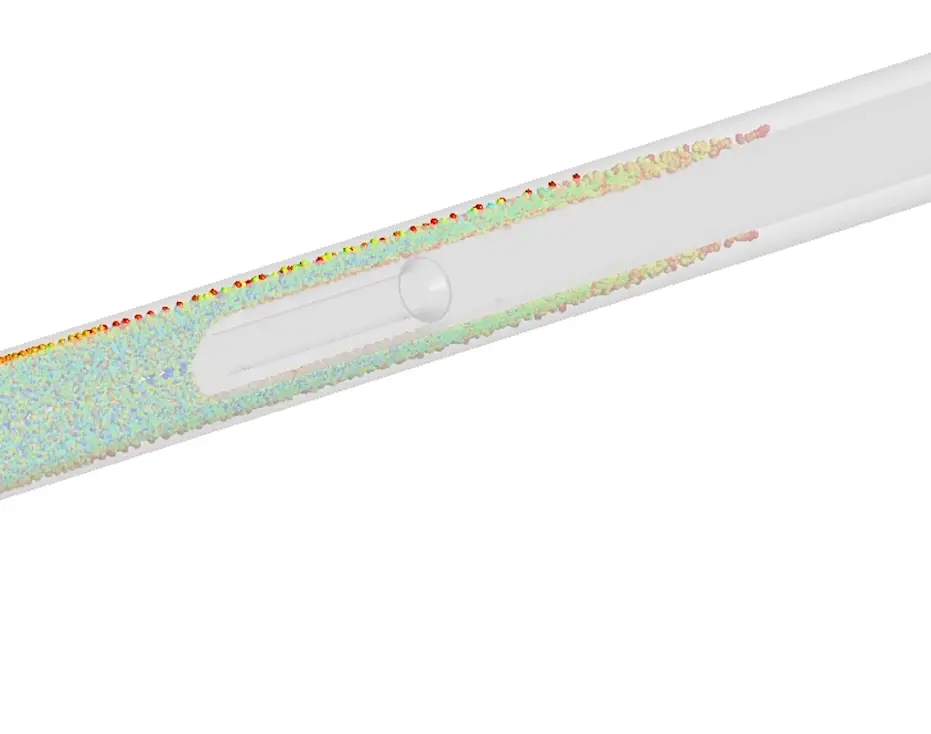
A full-scale 3D CFD simulation of a 30° well sector was performed in ANSYS Fluent. A 17-million-cell polyhedral mesh resolved the geometry of every filtration slot — just 300 µm wide — without simplification.
Sand trajectories were tracked using the Discrete Phase Model (DPM) with a Rosin–Rammler distribution (mean diameter 135 µm). Erosion rate was computed using the Oka model, which accounts for material hardness (1600 HV after boriding) and particle impact angle.
The simulation revealed a non-linear “sandblasting effect”: a 16-fold increase in flow velocity produces a 400-fold increase in erosion rate (the power-law dependency of the Oka model), leading to catastrophic failure.
Visualisation showed that within the narrow gap the particles have no distance to stabilise their trajectory and enter the slots at an aggressive angle, concentrating the wear at the slot inlet.
The simulation proved that the current arrangement — screens installed directly opposite the perforations — is unsuitable for long-term operation. It became a strong argument for offsetting the perforation interval relative to the screen sections.
The work passed a Petronas audit, allowing the client to avoid repeated emergency production shutdowns and costly remedial work.
Prepare the ventilation system of a laser cutting machine for serial production. The client needed to confirm fume extraction efficiency and determine the minimum airflow required to clear the working area.
The core objective was to eliminate the risk of hardware rework once mass sales began — virtual testing costs an order of magnitude less than redesigning a finished product.
Three design iterations were compared in ANSYS Fluent, using the Realizable k–ε turbulence model and a 1.7-million-cell mesh to resolve duct flow in detail.
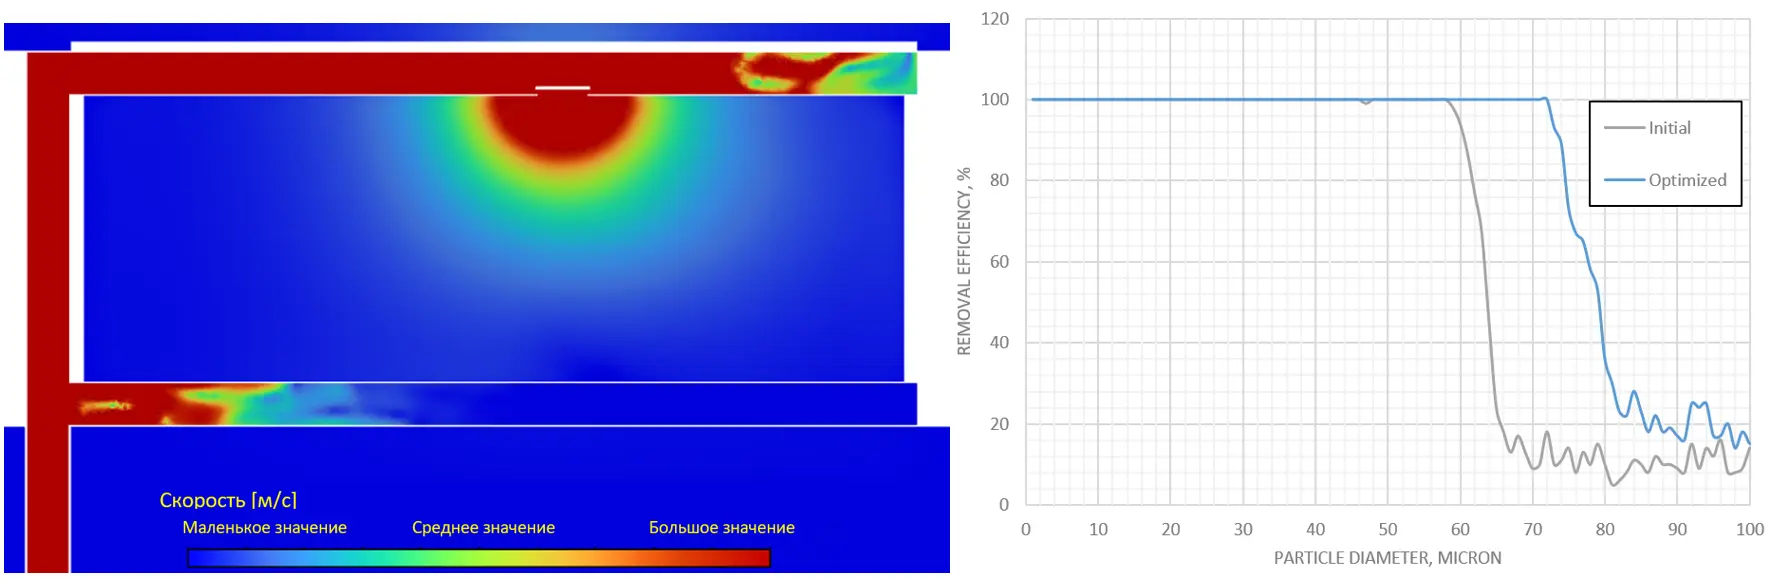
Cutting by-products (particles of 1–100 µm) were tracked using the Discrete Phase Model (DPM). The study assessed how contractions, duct fillets and different valve types affect the aerodynamic resistance of the system.
The simulation identified critical stagnation zones in the 90° bends, and suboptimal behaviour of the standard valve, which split the flow and encouraged dust to settle.
It demonstrated that replacing the valve with a door-type design and introducing fillets reduces static pressure magnitude in the ducts — the load on the extraction unit — by a factor of six.
The revised geometry raised the mean extraction diameter (d50) from 64 to 79 µm, delivering a 23% overall increase in efficiency.
The client received validated geometry recommendations and ventilation power requirements three weeks before production start, fully protecting the project from operational risk.
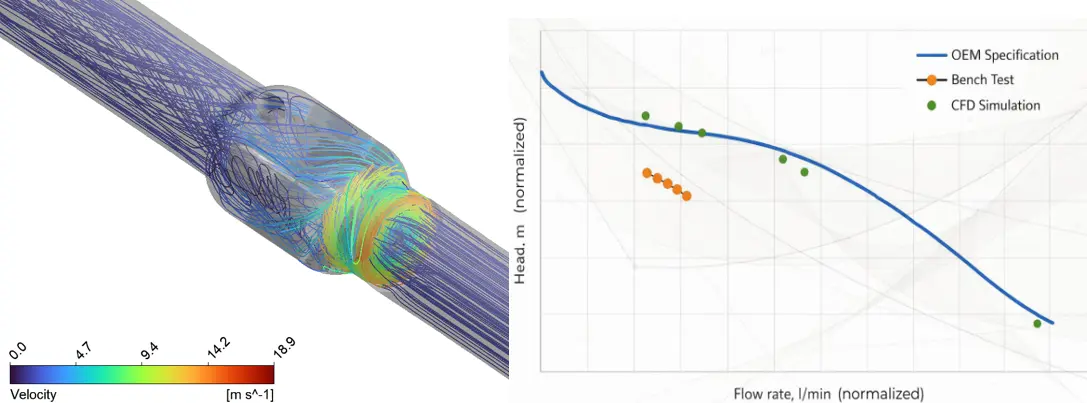
Bench testing of an axial pump prototype revealed a critical discrepancy: the measured flow rate was 2.5 times below the datasheet value.
The client suspected design errors in the reverse-engineered impeller geometry and was preparing a costly redesign of the entire series.
A CFD verification of the performance curve under idealised conditions was required to establish the true cause of the discrepancy.
The flow path was modelled in 3D in ANSYS Fluent. A 12-million-cell mesh resolved the near-wall layers in detail (y+ < 5), which is critical for correctly computing shear stress in the viscous sublayer. Rotation of the three-blade impeller was handled using the MRF approach; turbulence was modelled with k–ω SST, the recommended choice for turbomachinery. Fluid properties (transformer oil) were defined at the 90 °C operating temperature.
The computed head–flow (Q–H) curve showed close agreement with the manufacturer’s datasheet across the entire operating range.
The simulation proved that the existing pump geometry fully matches the reference design and delivers the required performance.
The analysis traced the faulty rig data to the rig layout: a pipe bend sat only 2–3 diameters upstream of the inlet, creating a non-uniform velocity field and distorting the pressure sensor readings.
The client received documented proof that the equipment did not require rework, avoiding the losses of an unnecessary design and prototyping cycle.
The report also delivered recommendations for upgrading the test rig: a straight run of at least 8–10 diameters upstream of the pump, to develop a stabilised flow and produce reliable acceptance data.